The share of road transportation in Greenhouse Gas Emissions has increased from 92% to 95% in the last 30 years.
Despite technological developments and modern vehicles, “greenhouse gas” emissions due to “road” transportation are increasing.
The largest share of “greenhouse gas” emissions originating from the transportation sector belongs to “road” transportation with 86.499% in 2019. This rate is constantly increasing.
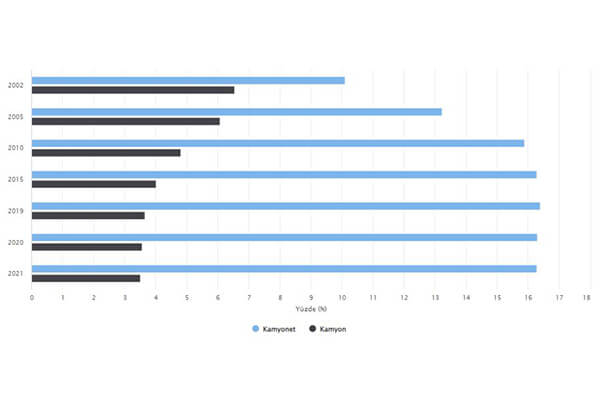
Although modern vehicles with technical features (with environmentally friendly engines) that will reduce “greenhouse gas” emissions are used in “road” transportation within the transportation sector, the share of “road” transportation is increasing. Could this be because the vehicles used especially on the road are old (old model) and there are many “repeat” and/or “return” transportations in domestic transportation?
Taşımacılık Türüne Göre Sera Gazı Emisyonu (kiloton CO2 eşdeğeri)
| Toplam | Hava yolu | Kara yolu | Demir yolu | Denizyolu | Diğer | Hava / Toplam | Kara / Toplam | Demir / Toplam | Deniz / Toplam | Diğer / Toplam | ||
|---|---|---|---|---|---|---|---|---|---|---|---|---|
| 1990 | 26,969 | 0,922 | 24,777 | 0,721 | 0,509 | 0,039 | 3,42% | 91,87% | 2,67% | 1,89% | 0,14% | |
| 1995 | 34,113 | 2,775 | 29,760 | 0,768 | 0,726 | 0,083 | 8,13% | 87,24% | 2,25% | 2,13% | 0,24% | |
| 2000 | 36,465 | 3,099 | 31,850 | 0,713 | 0,623 | 0,180 | 8,50% | 87,34% | 1,96% | 1,71% | 0,49% | |
| 2010 | 42,041 | 2,862 | 39,941 | 0,517 | 1,682 | 0,390 | 6,81% | 95,00% | 1,23% | 4,00% | 0,93% | |
| 2015 | 75,789 | 4,205 | 69,309 | 0,480 | 1,147 | 0,647 | 5,55% | 91,45% | 0,63% | 1,51% | 0,85% | |
| 2016 | 81,841 | 4,281 | 75,595 | 0,374 | 0,970 | 0,621 | 5,23% | 92,37% | 0,46% | 1,19% | 0,76% | |
| 2017 | 84,659 | 3,838 | 78,706 | 0,413 | 0,944 | 0,869 | 4,53% | 92,97% | 0,49% | 1,12% | 1,03% | |
| 2018 | 84,502 | 3,688 | 78,907 | 0,435 | 0,931 | 0,657 | 4,36% | 93,38% | 0,51% | 1,10% | 0,78% | |
| 2019 | 82,427 | 3,509 | 76,720 | 0,400 | 1,217 | 0,581 | 4,26% | 93,08% | 0,49% | 1,48% | 0,70% | |
| 2020 | 80,680 | 2,164 | 76,601 | 0,323 | 1,267 | 0,328 | 2,68% | 94,94% | 0,40% | 1,57% | 0,41% | |
| 2021 | 91,200 | 2,856 | 86,499 | 0,356 | 1,128 | 0,361 | 3,13% | 94,85% | 0,39% | 1,24% | 0,40% | |
| 1990 - 2021 Değişim | 238,17% | 209,76% | 249,11% | -50,62% | 121,61% | 825,64% | ||||||
Source: www.enerji.gov.tr


