[et_pb_section fb_built=”1″ _builder_version=”4.7.1″ _module_preset=”default” custom_margin=”0px||||false|false” custom_padding=”0px||0px||false|false”][et_pb_row _builder_version=”4.7.4″ _module_preset=”default”][et_pb_column type=”4_4″ _builder_version=”4.6.6″ _module_preset=”default”][et_pb_code _builder_version=”4.9.3″ _module_preset=”default” custom_padding=”||||false|false” border_radii=”on|5px|5px|5px|5px” box_shadow_style=”preset3″]
[/et_pb_code][/et_pb_column][/et_pb_row][et_pb_row column_structure=”1_2,1_2″ use_custom_gutter=”on” gutter_width=”1″ admin_label=”PDF Field” _builder_version=”4.7.7″ _module_preset=”default” custom_margin=”0px||0px||false|false” custom_padding=”0px||0px||false|false”][et_pb_column type=”1_2″ _builder_version=”4.7.7″ _module_preset=”default”][et_pb_text _builder_version=”4.9.4″ _module_preset=”default” hover_enabled=”0″ dipl_enable_visibility_manager=”on” dipl_visibility_manager_users=”logged-out” sticky_enabled=”0″]Please login to download this report as a pdf.
[/et_pb_text][/et_pb_column][et_pb_column type=”1_2″ _builder_version=”4.7.7″ _module_preset=”default”][et_pb_image src=”https://insights.tirport.com/wp-content/uploads/2021/01/Adobe-PDF-File-Icon-02.png” alt=”Download as PDF” title_text=”Download as PDF” url_new_window=”on” align=”right” _builder_version=”4.9.4″ _module_preset=”default” width=”50px” custom_margin=”0px||0px||false|false” custom_padding=”0px||0px||false|false” hover_enabled=”0″ dipl_enable_visibility_manager=”on” dipl_visibility_manager_show_hide=”hide” dipl_visibility_manager_users=”logged-out” url=”https://static.insights.tirport.com/pdf/171_Shares_of_Vehicles_Entering_from_All_Border_Gates.pdf” sticky_enabled=”0″][/et_pb_image][/et_pb_column][/et_pb_row][et_pb_row _builder_version=”4.5.2″ _module_preset=”default” custom_margin=”||0px||false|false” custom_padding=”||20px||false|false”][et_pb_column type=”4_4″ _builder_version=”4.6.6″ _module_preset=”default”][et_pb_text _builder_version=”4.9.4″ _module_preset=”default” text_font=”Montserrat||||||||” text_font_size=”16px” text_line_height=”1.9em” custom_padding=”15px||||false|false”]
“59% of the vehicles that” enter “from all border gates are” Semi Trailer Truck, Tow, bed Truck, Trailer “type vehicles.”
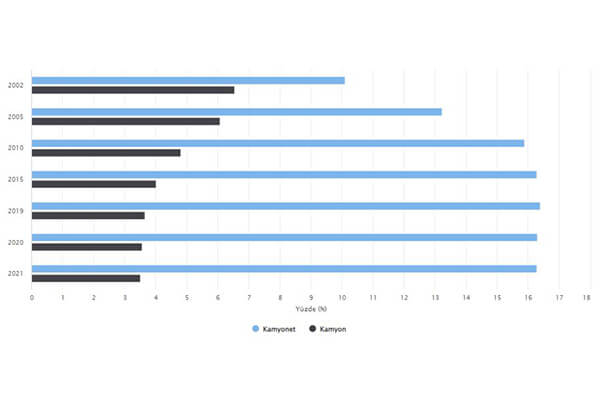
In the period of 2008-2019, while the ratio of ” LCV (Light commercial vehicle) and Trucks” and “tanker” among the vehicles “entering” from all border gates decreased, the rate of “” Semi Trailer Truck, Tow Truck, bed Truck, Trailer” increased.
[/et_pb_text][et_pb_code _builder_version=”4.9.4″ _module_preset=”default”]
Vehicles Accessing from All Border Gates
| 2008 | 2009 | 2010 | 2011 | 2012 | 2013 | 2014 | 2015 | 2016 | 2017 | 2018 | 2019 | 2020 (January-November) | 2008 - 2019 Variation | |
|---|---|---|---|---|---|---|---|---|---|---|---|---|---|---|
| Total vehicle | 2.285.450 | 2.782.250 | 3.646.525 | 3.857.446 | 3.222.048 | 3.550.794 | 3.802.158 | 4.154.895 | 3.686.967 | 4.052.488 | 3.725.110 | 4.481.354 | 2.707.897 | 96,1% |
| Total vehicle (Load) | 1.117.311 | 1.402.691 | 1.634.025 | 1.755.992 | 1.621.804 | 1.741.059 | 1.966.819 | 1.923.127 | 1.807.894 | 2.000.638 | 1.954.609 | 2.071.732 | 1.753.924 | 85,4% |
| Semi Trailer Truck-Towing-Truck bed-Trailer | 837.736 | 972.768 | 1.096.007 | 1.199.347 | 1.175.913 | 1.314.402 | 1.629.539 | 1.643.673 | 1.566.944 | 1.746.521 | 1.731.627 | 1.846.023 | 1.607.872 | 120,4% |
| Tanker | 43.571 | 18.083 | 9.800 | 3.790 | 13.014 | 2.053 | 2.634 | 1.686 | 8.335 | 16.747 | 39.130 | 38.330 | 18.264 | -12,0% |
| Truck-LCV (Light commercial vehicle) | 236.004 | 411.840 | 528.218 | 552.855 | 432.877 | 424.604 | 334.646 | 277.768 | 232.615 | 237.370 | 183.852 | 187.379 | 127.788 | -20,6% |
For other data that may be related to this statistic, you can refer to the pages “Shares of Vehicles Exiting from Land Border Gates“,“Share of the Vehicles Entering Through Land Border Gates ,“Shares of Vehicles Exiting from All Border Gates”
[/et_pb_text][et_pb_text _builder_version=”4.9.3″ _module_preset=”default” custom_margin=”0px||||false|false” custom_padding=”0px||||false|false”]
Source: Ministry of Trade, Ministry Statistics, Customs Statistics, Foreign Trade Data, Vehicle Entry-Exit Numbers by Types
- 2020 (January-November)
[/et_pb_text][/et_pb_column][/et_pb_row][/et_pb_section]


