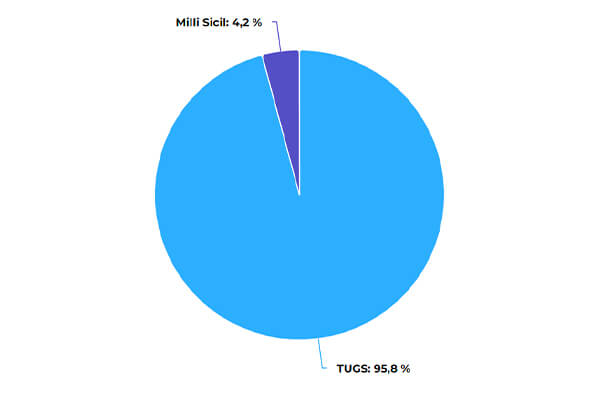
The most quantity of fuel is used in “road” transportation.
In 2017, 30.565.439 tons of fuel were consumed in “road” transportation, 430.870 tons in “sea transport” and 1.129.055 tons of fuel in “airway” transportation, 95.14% of the total fuel consumption belongs to “road” transportation.
77.79% of the fuel consumed in “road” transportation is diesel, 13.35% is autogas and 8.86% is gasoline. (Fuel Consumption by Fuel Types in Road Transportation)
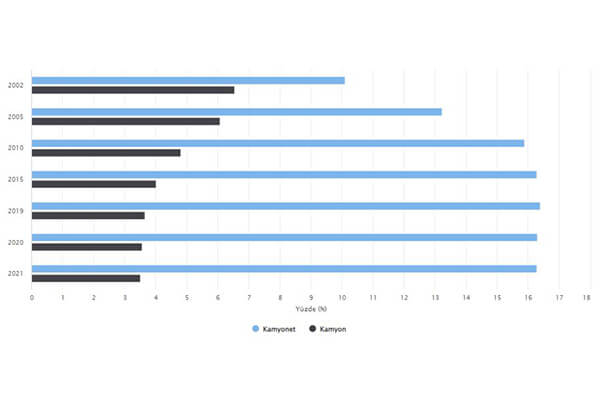
In the period of 2006-2017, total fuel consumption in “road” transportation increased by 0.5%. Despite such a small increase in fuel consumption in “road” transportation, there is a significant increase in the rate of “greenhouse gas” in “road” transport (Greenhouse Gas Emissions Share by Transport Type)
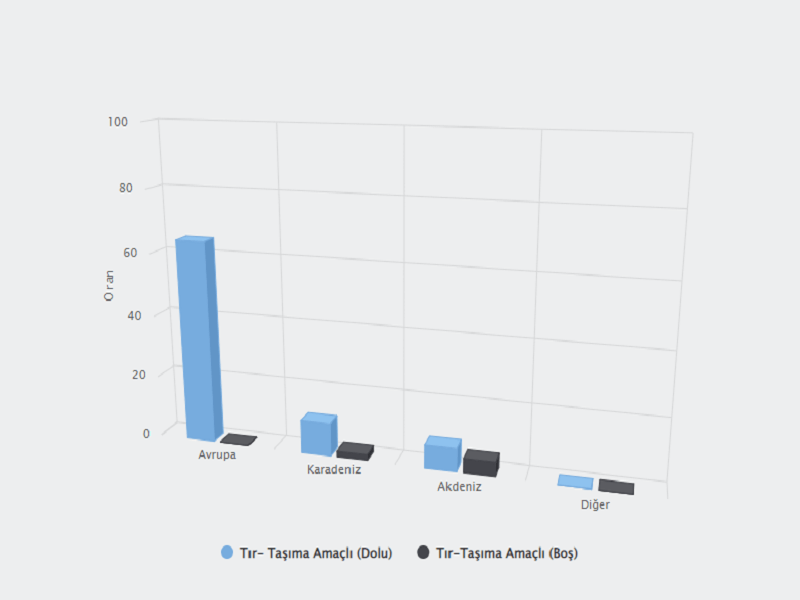
Despite the use of modern vehicles with “greenhouse gases” reduction characteristics (environmentally friendly engines) in the transport sector, the share of “greenhouse gases” emission within the sector is encreasing . Could the reason for this be that: especially the vehicles used in “road” transportation are old (the model) and there are more “repeated” and / or “return” transports in domestic transportation?
Fuel Consumption by Transport Type (Ton)
| Fuel Consumption by Transport Type (Ton) | |||||||
|---|---|---|---|---|---|---|---|
| Road | Seaway | Airway | Total | Road / Total | Seaway / Total | Airway / Total | |
| 2006 | 16.937.978 | 2.065.326 | 413.222 | 19.416.526 | 87,23% | 10,64% | 2,13% |
| 2007 | 17.890.847 | 1.340.153 | 442.823 | 19.673.823 | 90,94% | 6,81% | 2,25% |
| 2008 | 17.913.752 | 1.390.615 | 475.304 | 19.779.671 | 90,57% | 7,03% | 2,40% |
| 2009 | 18.206.872 | 1.223.045 | 527.936 | 19.957.853 | 91,23% | 6,13% | 2,65% |
| 2010 | 18.461.624 | 1.349.945 | 635.696 | 20.447.265 | 90,29% | 6,60% | 3,11% |
| 2011 | 19.348.914 | 1.616.703 | 767.369 | 21.732.986 | 89,03% | 7,44% | 3,53% |
| 2012 | 20.656.990 | 1.905.993 | 1.151.546 | 23.714.529 | 87,11% | 8,04% | 4,86% |
| 2013 | 21.746.587 | 1.345.664 | 1.194.046 | 24.286.297 | 89,54% | 5,54% | 4,92% |
| 2014 | 22.557.586 | 1.453.360 | 1.229.406 | 25.240.352 | 89,37% | 5,76% | 4,87% |
| 2015 | 25.740.274 | 1.898.474 | 1.319.436 | 28.958.184 | 88,89% | 6,56% | 4,56% |
| 2016 | 27.848.652 | 396.816 | 1.123.702 | 29.369.170 | 94,82% | 1,35% | 3,83% |
| 2017 | 30.565.439 | 430.870 | 1.129.055 | 32.125.364 | 95,14% | 1,34% | 3,51% |
| 2006-2017 Change | 80,5% | -79,1% | 173,2% | 65,5% | |||


